


What a test report is, what goes in one, the main types, a test summary report template, and a worked example.
A test report turns hundreds of test results into one answer: is this build ready to ship? This guide covers what a test report is, the main types, what to include, a test summary report template with a worked example, the metrics that matter, and how reports and dashboards (including those in Katalon TestOps) fit together.
What is a test report?
A test report is a document that summarizes what was tested, how the tests went, and which defects and risks remain open, so stakeholders can decide whether a build is ready to release. Test reporting is the ongoing work of collecting those results and sharing them as documents, dashboards, or alerts.
A test report is not the same as the raw output of a test run. Three documents get mixed up:
Document | What it is | Who reads it | When it is made |
|---|---|---|---|
Test log | The step-by-step record of a run: environment, each step, timestamps, and errors | Testers and developers debugging a failure | During every run, automatically for automated tests |
Test execution report | The results of one run or suite: passed, failed, skipped, and duration | QA engineers and the team | After each run |
Test report | The whole cycle or release: results, defects, risks, and a recommendation | Test leads, product owners, release managers | During a cycle (progress) and at its end (summary) |
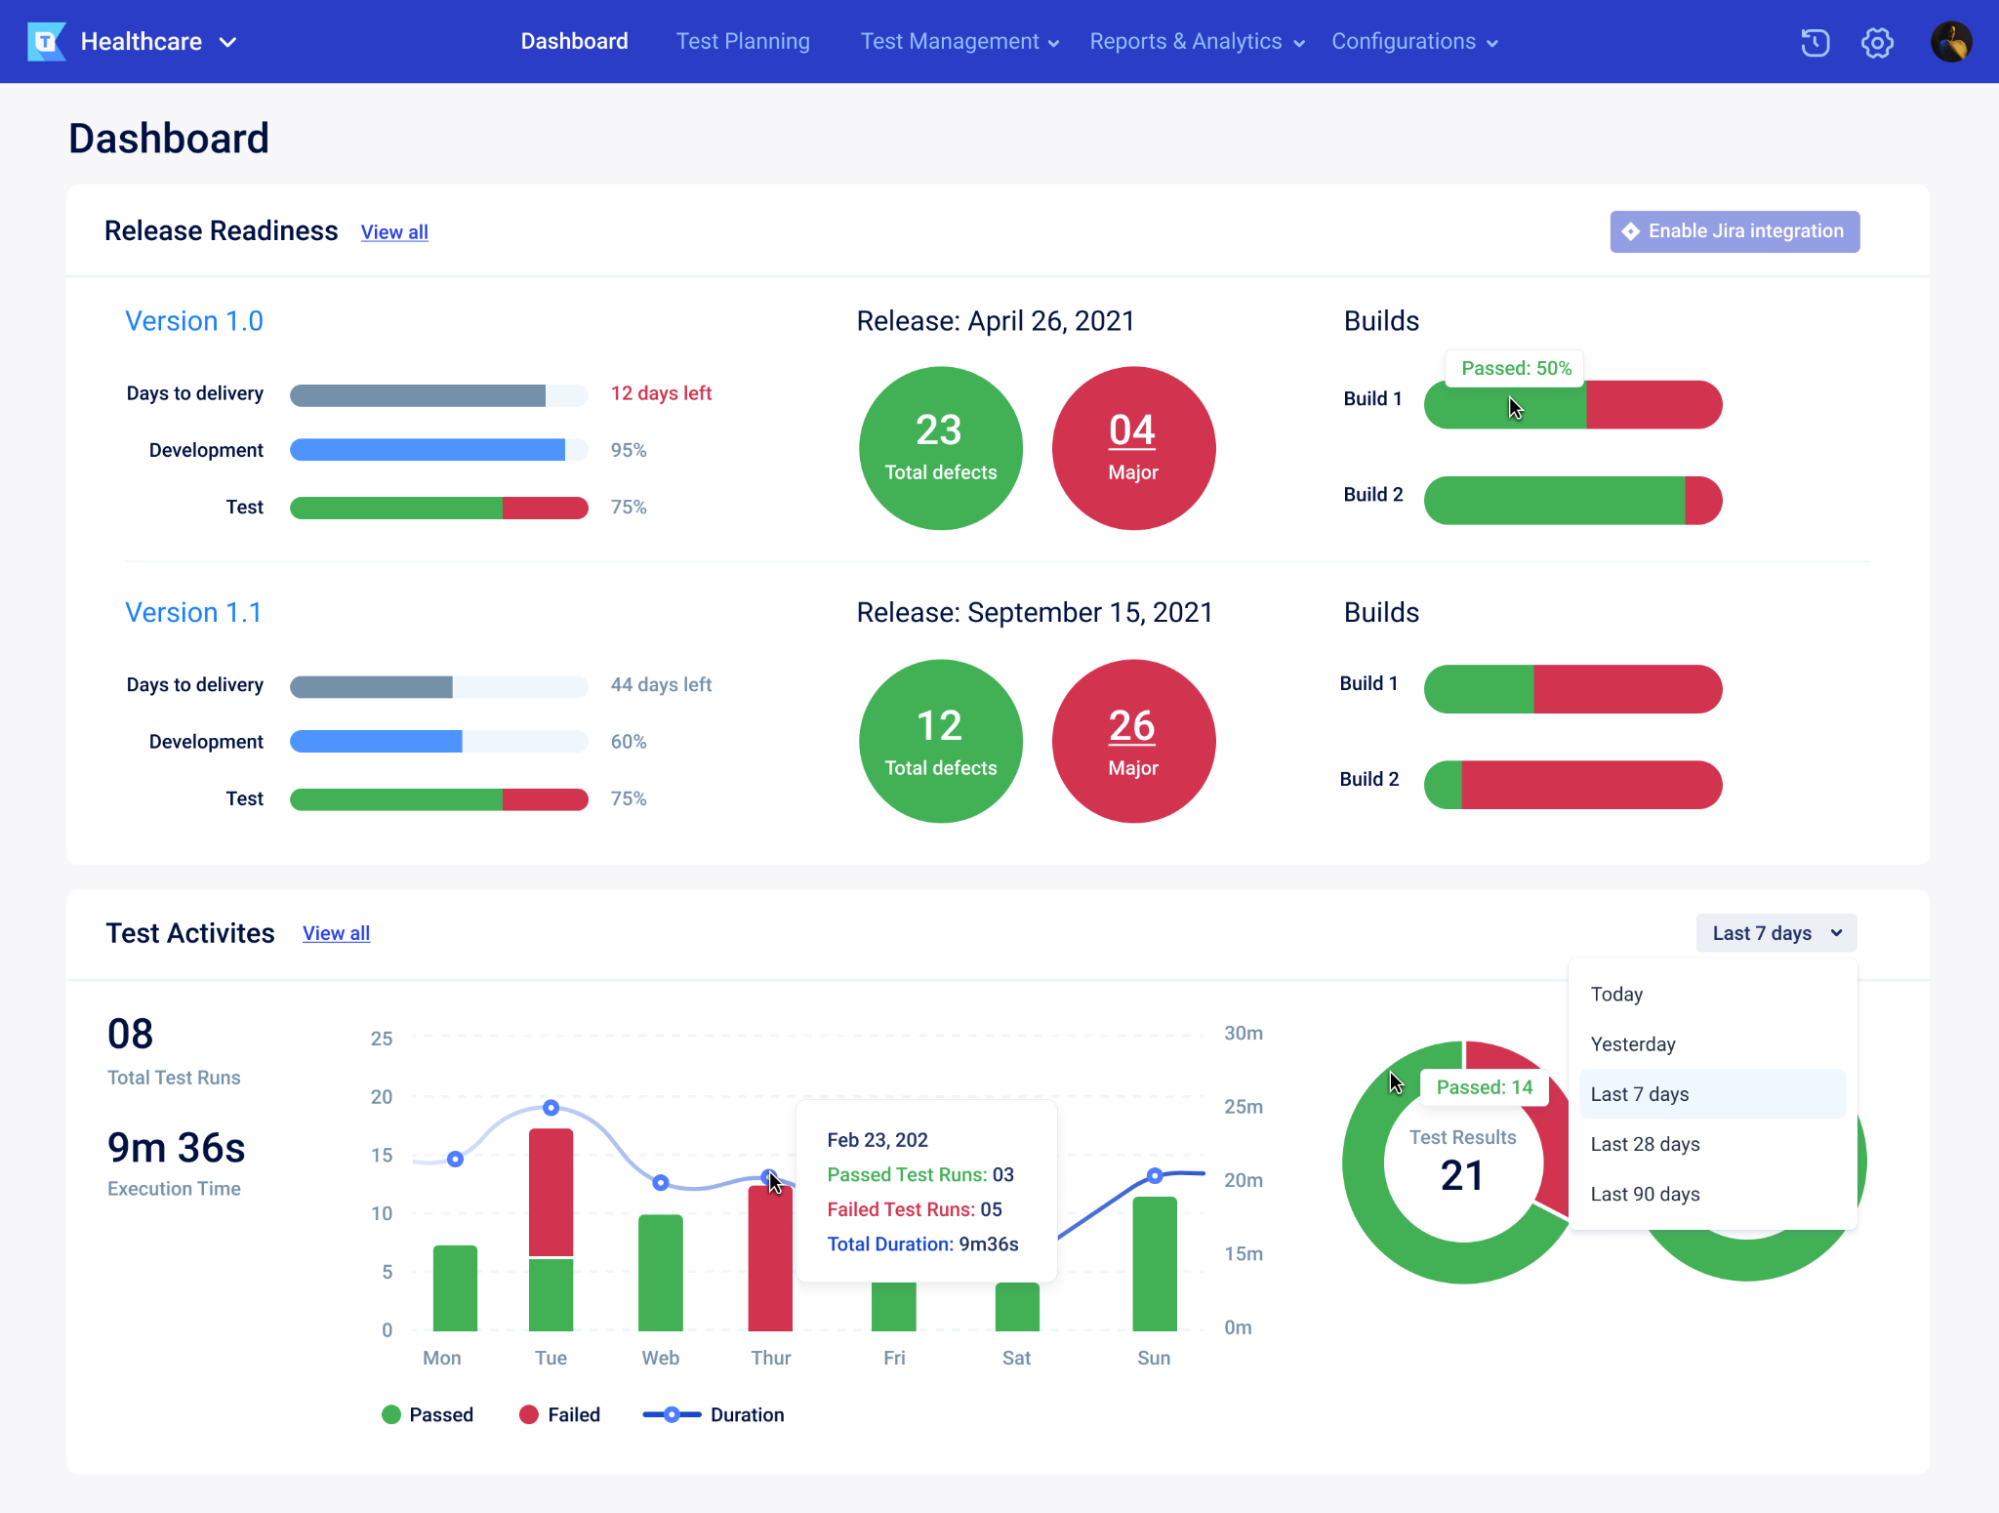
A test log like the one above tells you exactly which step failed and on which browser. It doesn't tell you whether the release is safe. That's the job of the report, which is built from many logs and a test execution report per run.
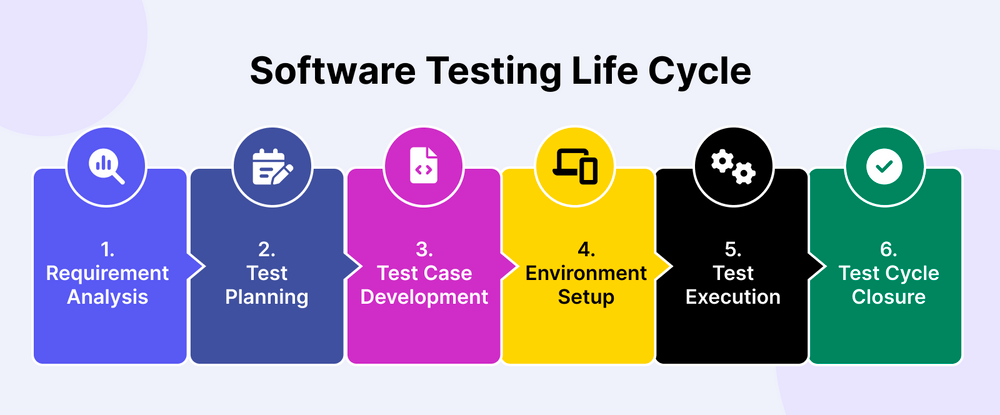
In the software testing life cycle, the final test report belongs to test cycle closure, the last stage after test execution. Progress reports appear earlier, while tests are still running. Both are part of test management.
Why test reports matter
- They support a decision. A release manager rarely reads 400 results. They need to know what passed, what's broken, what wasn't tested, and what the QA lead recommends.
- They make risk visible. An open critical defect or an untested payment flow is a business risk, not only a QA detail. The report puts it in front of the people who own that risk.
- They show progress against the plan. Comparing executed tests and exit criteria against the test plan shows whether testing is on track or slipping.
- They leave a record. Audits, regulated releases, and client handovers often need a signed-off document that shows what was tested and who accepted the risk.
- They improve the next cycle. Trends in flaky tests, escaped defects, and blocked environments show where the test process itself needs work.
Types of test reports
Teams commonly use 3 reports across a release. The names vary: IEEE 829-1998 called the end-of-cycle document a test summary report, while ISO/IEC/IEEE 29119-3 and the current ISTQB glossary call it a test completion report, and call the progress report a test status report. Many teams write a summary report at the end of each cycle and a final completion report at the end of the release, as in the table below.
Report | When it is made | Cadence | Audience | Purpose |
|---|---|---|---|---|
Progress (status or interim) report | During a test cycle | Daily in a release crunch, or once a sprint | Team, QA lead, product owner | Show progress against the plan, blockers, and new risks |
Test summary (test cycle) report | End of each test cycle or release candidate | Once per cycle | Product owner, release manager | Evaluate results against exit criteria and recommend ship, ship with caveats, or hold |
Test completion (closure) report | End of the project or release | Once | Stakeholders, auditors, the next project team | Final record: what was tested, residual risks, lessons learned |
A report can also be requested at any time, for example after a production incident or a major late change resets the risk picture.
Other reports teams use alongside these:
- Defect report: open and closed defects by severity, priority, and status, and how long they stay open. Not to be confused with a single bug report; see our bug report template.
- Test execution report: the results of one run or suite, covered in more detail under test result reports for automated runs below.
- Automation report: results from automated suites, usually per CI build.
- Re-run report: the final result of each test after automatic retries, so a test that failed once and passed on retry is counted once, with its retry recorded.
- Flaky test report: tests whose result flips between pass and fail without any code change. See how to handle flaky tests.
- Stale test report: tests that haven't run in a long time or that cover features that have changed, so the team can update or retire them.
- Traceability report: each requirement linked to its tests, results, and defects, usually as a traceability matrix.
You don't always need a formal document. During a sprint, a shared dashboard and a stand-up update often do the job. Keep the written summary report for release decisions, audits, and handovers.
What to include in a test report
A useful test report answers 10 questions. The examples come from the worked example further down.
Component | What it answers | Example |
|---|---|---|
Project, build, and environment | What exactly was tested, and where? | Online store release 4.2, build 4.2.0-rc3, staging, Chrome, Firefox, Safari, and Edge plus mobile web |
Scope | What was in scope? | Checkout, saved cards, promo codes and gift cards, cart, sign-in, order history |
Not tested, and why | What wasn't tested? | Gift card cases, deferred by the product manager; 8 payment cases blocked |
Execution summary | How many tests were planned, run, passed, failed, blocked, not run? | 412 planned, 398 executed, 371 passed, 27 failed, 8 blocked, 6 not run |
Failure triage | Why did tests fail? | 16 product bugs, 6 test issues, 4 environment, 1 test data |
Defect summary | What's still broken, and how badly? | 16 raised: 1 critical, 3 high, 8 medium, 4 low; 11 still open |
Coverage | How much of the requirements did we test? | 46 of 48 requirements have at least one executed test |
Risks and known issues | What could go wrong in production? | Duplicate card charge on payment retry (DEF-311) |
Exit criteria status | Did we meet the bar we agreed on? | 3 of 6 criteria not met |
Recommendation and sign-off | Should we ship, and who decided? | Hold; signed by the QA lead and the product manager |
Coverage is easier to report honestly when every test case is linked to a requirement. A traceability matrix gives you that link, whichever tool you use.
Test summary report template
A test summary report is a summary of the testing activities and results for a cycle or release, with an evaluation against the exit criteria agreed in the test plan. Copy the table below into your wiki, document, or spreadsheet. The right-hand column is filled in for the worked example.
Section | What to write | Example: online store release 4.2 |
|---|---|---|
Project and release | Product, release, cycle | Online store, release 4.2, test cycle 3 (regression) |
Build and environment | Build number, environment, browsers or devices | 4.2.0-rc3, staging, Chrome, Firefox, Safari, and Edge (latest two versions), iPhone and Android mobile web |
Test period | Start and end dates | 30 November to 2 December 2026 |
Objectives | What this cycle had to prove | The new checkout and saved cards work end to end on every supported browser; no regressions in cart, sign-in, and order history |
In scope | Features and test types covered | Regression of checkout, saved cards, promo codes and gift cards, cart, sign-in, and order history |
Not tested and why | Areas skipped, blocked, or deferred | Gift card cases deferred by the product manager (6 cases); 8 payment cases blocked by the payment sandbox |
Execution summary | Planned, executed, passed, failed, blocked, not run | 412 planned; 398 executed (371 passed, 27 failed); 8 blocked; 6 not run |
Pass rate and progress | Passed divided by executed; executed divided by planned | 93.2% pass rate; 96.6% executed |
Defects by severity | Raised and still open, per severity | Critical 1 (1 open), high 3 (1 open), medium 8 (5 open), low 4 (4 open) |
Top risks and known issues | The 1 to 3 things that could hurt users | DEF-311: payment retry charges the card twice |
Exit criteria status | Each criterion from the test plan, met or not met | 3 not met, 2 met, 1 pending (see the exit criteria check below) |
Recommendation | Ship, ship with caveats, or hold, in one sentence | Hold until DEF-311 and DEF-305 are fixed and the blocked payment cases and payment suites pass |
Sign-off | Name, role, date | QA lead and product manager, 2 December 2026 |
How to fill it in: write the recommendation last but put it at the top when you share the report. Keep each cell to one or two lines and link out to the run results and defect list for detail. A progress report can drop the objectives, exit criteria, recommendation, and sign-off rows and add a "next steps" row instead.
Test report example: release 4.2, cycle 3 (regression)
All numbers below are illustrative. The release is the same online store release 4.2 used in our test plan example, so the exit criteria come straight from that plan.
Execution summary
Measure | Count | Note |
|---|---|---|
Planned | 412 | Checkout, saved cards, promo codes and gift cards, cart, sign-in, order history |
Executed | 398 | 371 passed, 27 failed |
Blocked | 8 | Payment sandbox down on 1 December |
Not run | 6 | Gift card cases deferred by the product manager |
Pass rate | 93.2% | 371 of 398 executed tests |
Execution progress | 96.6% | 398 of 412 planned tests |
Failure triage. Every one of the 27 failures was checked before it was counted as a product problem:
Cause | Failures | What happens next |
|---|---|---|
Product bug | 16 | Raised as 16 defects |
Test issue (outdated locator or assertion) | 6 | Tests fixed, re-run in cycle 4 |
Environment (staging timeouts) | 4 | Re-run after the environment fix |
Test data (expired coupon code) | 1 | Data replaced, re-run in cycle 4 |
Defects raised
Severity | Raised | Still open | Example |
|---|---|---|---|
Critical | 1 | 1 | DEF-311: payment retry charges the card twice |
High | 3 | 1 | DEF-305: promo code ignored at checkout on Safari |
Medium | 8 | 5 | DEF-308: order history filters reset after going back |
Low | 4 | 4 | DEF-314: typo on the order confirmation page |
Exit criteria check (the 6 exit criteria copied from the test plan)
Exit criterion | Result | Status |
|---|---|---|
All P1 and P2 test cases executed, and all P1 cases passed | 8 P1 payment cases blocked; P1 failures linked to DEF-311 and DEF-305 | Not met |
No open critical or high defects; medium defects have an agreed fix date or workaround | 1 critical and 1 high open; 5 medium open | Not met |
Automated regression suite passes on the final release candidate | Checkout and payment suites fail on 4.2.0-rc3 | Not met |
Accessibility review finds no blocking issues | No blocking issues found | Met |
UAT signed off by the product manager | UAT done; sign-off waits for the fixes and the go or no-go meeting on 3 December | Pending |
Test summary report shared with the release manager | This report, shared 2 December | Met |
Recommendation: hold. Blocker: DEF-311 (critical). Fix DEF-311 and DEF-305, restore the payment sandbox, then run the 8 blocked payment cases and the full checkout and payment suites again in an extra cycle 4. The deferred gift card cases stay untested and move to release 4.3.
The same cycle for 3 audiences
The data stays the same. The length changes with the reader.
- Developers, in the team chat: "4.2 cycle 3 (regression): 398 of 412 run, 93.2% pass, 1 critical open (DEF-311, double charge on retry), 8 payment cases blocked by the sandbox."
- Product manager, in the sprint summary: 5 lines covering progress (96.6% executed), the top risk (DEF-311), what's blocked (payment sandbox), what moves to cycle 4 (re-runs and fixes), and what's deferred (gift card cases).
- Leadership, before the release decision: the filled template above, starting with the recommendation and the one risk that drives it.
Test report metrics and formulas
Pick the few metrics that support the decision in front of you. For a wider set, see our guide to test automation metrics.
Metric | Formula | What it tells you |
|---|---|---|
Execution progress | Executed tests divided by planned tests | How much of the plan has run |
Pass rate | Passed tests divided by executed tests | Quality of what has run so far |
Failure rate | Failed tests divided by executed tests | The share of runs that need triage |
Blocked tests | Count of tests that couldn't run, with the reason | Untested scope hiding behind environment or dependency problems |
Defect density | Defects found divided by the size of the code or feature, such as per 1,000 lines of code or per story point, compared across modules | Which areas are the least stable |
Defect severity distribution | Open defects grouped by severity | Whether open defects are cosmetic or release blockers |
Defect closure rate | Defects closed divided by defects raised | Whether fixes keep up with new defects |
Requirements coverage | Requirements with at least one executed test divided by all requirements | How much of what was promised has been checked |
Automation coverage | Automated test cases divided by all test cases in scope | How much of the suite can run without a tester |
Flaky rate | For one test, runs where its result changed without a code change divided by its total runs | How much you can trust a red result |
One run on its own can mislead. A 93% pass rate is good news after 85% and bad news after 98%. Show the last 3 to 5 cycles side by side (illustrative values, 398 tests executed in each cycle):
Cycle | Pass rate | New failures | Recurring failures | Flaky tests |
|---|---|---|---|---|
Cycle 1 (20 Nov) | 88.4% | 46 | 0 | 5 |
Cycle 2 (27 Nov) | 91.0% | 18 | 18 | 7 |
Cycle 3 (2 Dec) | 93.2% | 9 | 18 | 6 |
Here the pass rate is improving, but the same 18 failures have shown up in every cycle since cycle 1. That's a stronger signal than any single pie chart of passed and failed tests.
Test reporting dashboards vs test reports
A dashboard and a report answer the same question at different speeds. A dashboard updates as new results come in; a report is a snapshot someone has read, explained, and signed.
Aspect | Live dashboard | Test report document |
|---|---|---|
Data | Updates with every run | Fixed at a point in time |
Best for | Daily stand-ups, sprint reviews, spotting trends early | Release decisions, audits, client handovers |
Who reads it | The team, test leads, engineering managers | Product owners, release managers, auditors |
Includes a recommendation | No, the reader interprets it | Yes, with the reasoning behind it |
Sign-off | No | Yes, when the release or contract needs it |
Use a live dashboard for day-to-day test reporting. Keep a signed-off document when a decision needs a named owner: regulated releases, audits, and client handovers. A good QA dashboard shows:
- Pass and fail trend by build, not only the latest run
- Release readiness against the exit criteria
- Open defects by severity and priority
- Flaky and slow tests, kept separate from real failures
- Coverage per browser, OS, or device configuration
- Execution duration over time, so a slowing suite gets noticed
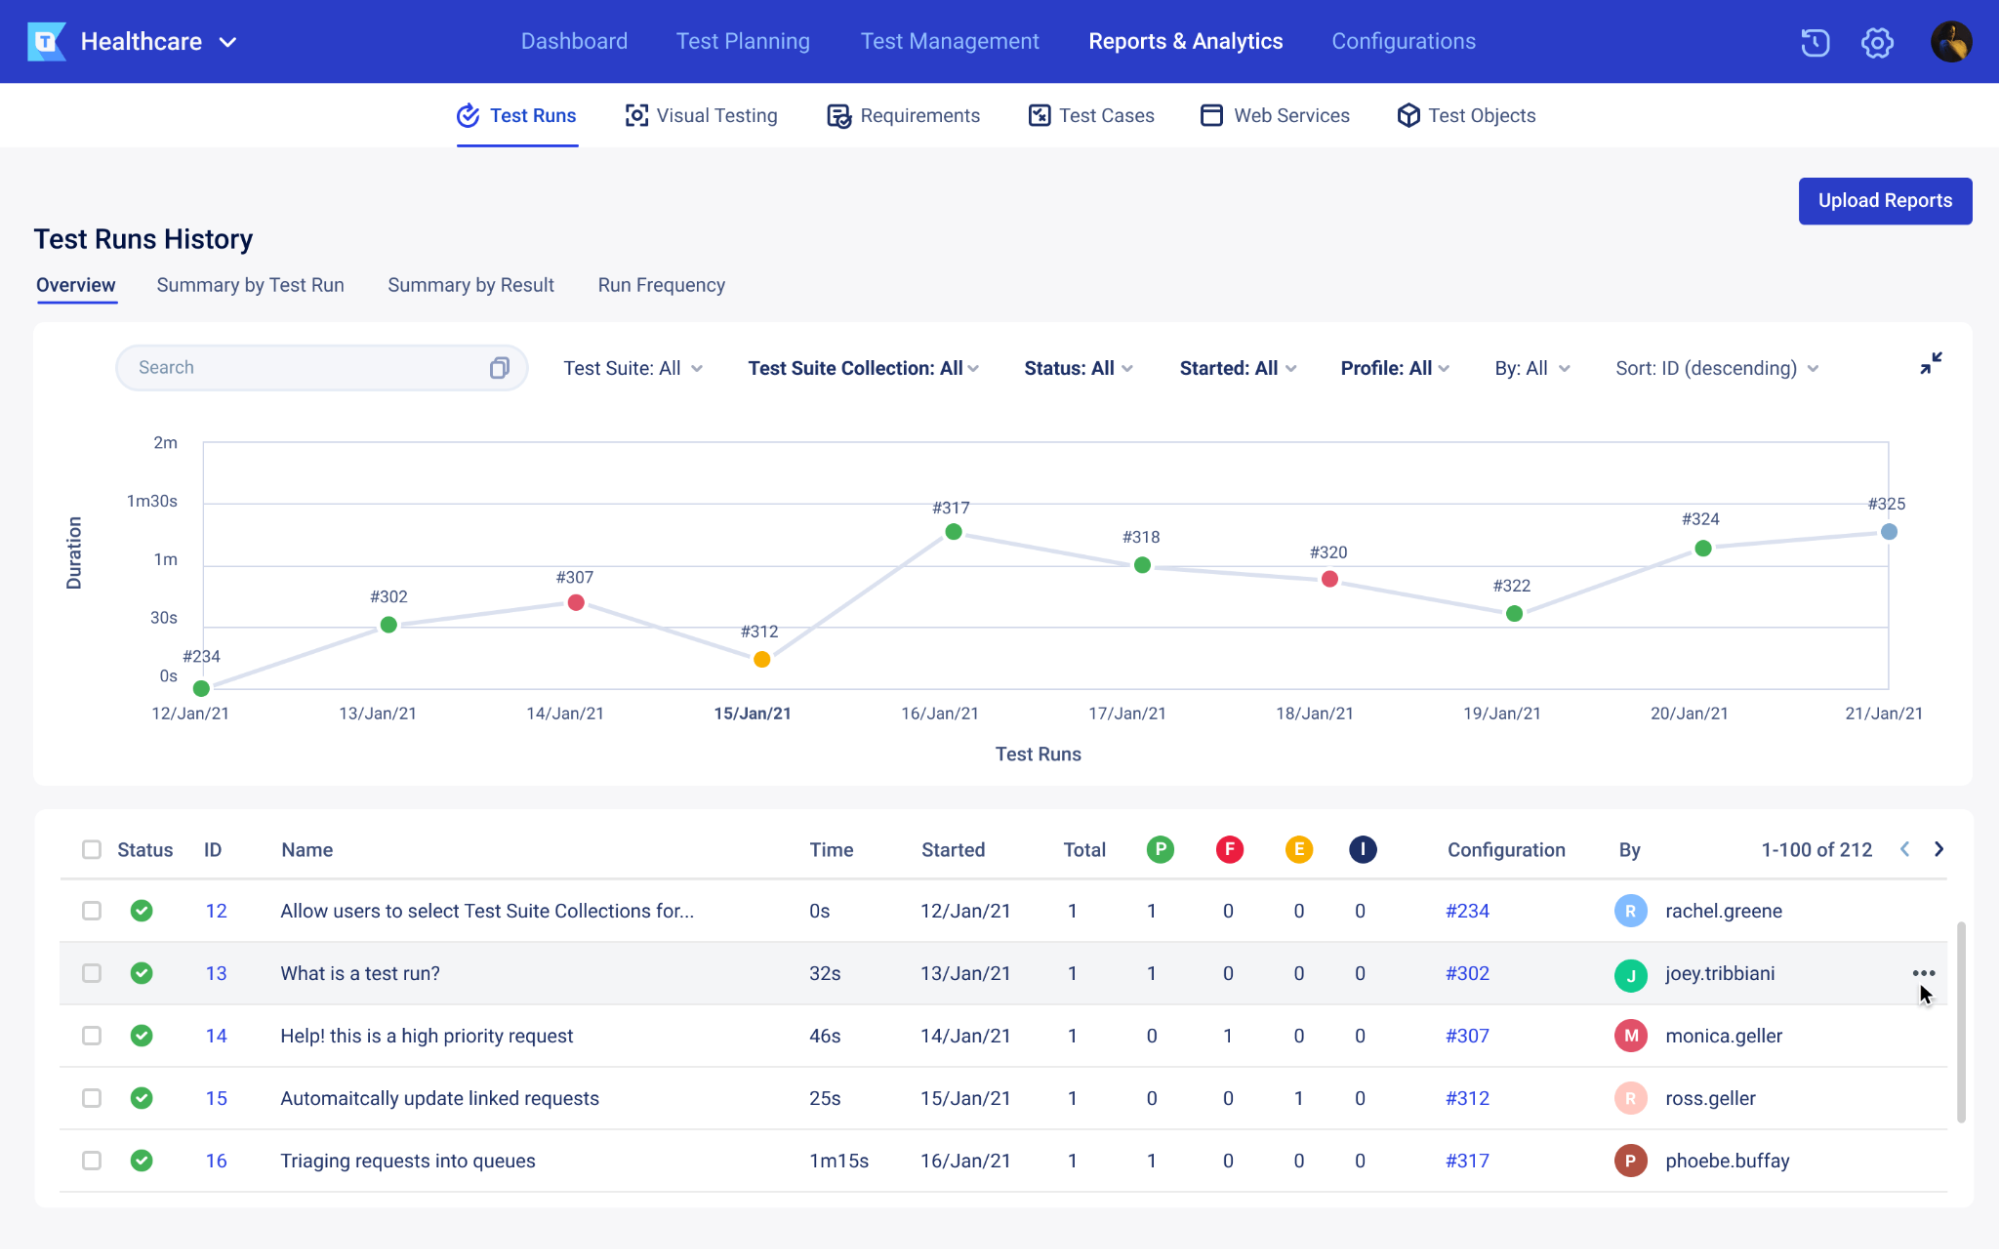
To get these views without building them by hand, use TestOps. Its Analytics & Trends, Release Health, and Live Monitor dashboards give quick summaries, and reports such as Test Runs Analysis, Defects Activity Analysis, and Requirement Coverage Analysis go deeper. The Release Health dashboard (also called Release Readiness) marks a release or sprint as Ready or At Risk against gates a Project Admin sets: a minimum requirement coverage, a minimum pass rate, and blocking-defect rules by priority and severity. Defect reports and defect rules need Jira or Azure DevOps connected.
You can export a dashboard or report to PDF or CSV or share it by link, and an automated run can email a PDF of its results when it finishes. Results uploaded from Katalon Studio, Playwright, Jest, Pytest, Robot Framework, and other frameworks are analyzed in one place.
If you're comparing options, see our roundup of test reporting tools.
Test result reports for automated runs
A test result report for an automated run pulls together logs, framework reports (often HTML or JUnit XML), screenshots, and run history. Reporting it honestly takes a few rules:
- Count each test once. If a test fails and then passes on retry, report the final result and note the retry, as a re-run report does.
- Separate flaky and quarantined tests from real failures. Otherwise one unstable test makes a healthy build look broken, and the team stops trusting red builds.
- Tag every failure by cause: product bug, test issue, environment, or test data. Environment noise shouldn't read as product risk.
- Report trends per pipeline, not only the latest build.
For per-run detail, see the automation test execution report and test execution report guides.
How to write a test report
- Decide who reads it and what decision it supports. A release go or no-go needs a different report from a daily status update. In the example, the reader is the release manager deciding on 4.2.
- Fix the scope and the exit criteria from the test plan. Copy the criteria as written, so you can't adjust the bar after the results come in. Release 4.2 has 6 exit criteria.
- Collect results and triage every failure before counting. Sort failures into product bug, test issue, environment, and test data. In the example, only 16 of 27 failures were product bugs.
- Calculate the metrics and compare them with the last 3 to 5 cycles. The 93.2% pass rate only means something next to 88.4% and 91.0%.
- State the risks and the untested areas plainly. Name the blocked payment cases and the deferred gift card cases, and what each leaves uncovered.
- Write the recommendation first, then the evidence, and get sign-off. "Hold until DEF-311 and DEF-305 are fixed" goes at the top; the tables go underneath.
Common test reporting mistakes and how to fix them
- Numbers with no analysis. A table of results isn't a report. Fix: start with the recommendation and the 1 to 3 findings that drive it.
- One snapshot, no trend. A single run hides whether quality is improving. Fix: show the last 3 to 5 cycles side by side.
- Treating every failure the same. Test issues and environment problems inflate the failure count. Fix: triage before you count, and report each cause separately.
- Hiding what wasn't tested. Blocked and deferred tests are untested scope. Fix: give "not tested and why" its own row.
- A pass rate with nothing to compare it to. 93% says little without a target or a previous cycle. Fix: check results against the exit criteria in the test plan.
- One report for every audience. Executives tend to skip 4 pages of tables; developers need the defect IDs. Fix: write the short version for each reader from the same data.
- A report that arrives after the decision. Fix: agree the report date with the release manager when you plan the cycle, and send progress reports before it.
Note what's improved since the last cycle too, such as fewer recurring failures or a shorter run. It helps the team see what's working and keep doing it. And be honest about the limits: a test report shows what was tested and what was found. It can't prove the software has no bugs, so state the residual risk alongside the recommendation, especially for areas like regression testing that were cut short.
Frequently asked questions
A test plan is written before testing and sets the scope, approach, schedule, and exit criteria. A test report is written during or after testing and shows what actually happened against that plan, ending with a recommendation.
Usually the test lead or QA manager writes it from the team's results. The product owner, release manager, or project sponsor signs it off, because they own the release decision it supports.
Whatever your readers already use: a wiki page, a shared document, or a PDF exported from your test management tool. The format matters less than the order: recommendation first, then the risks, then the numbers. Keep a PDF or signed copy for audits and client handovers.
Yes, if the open defects fall within the agreed exit criteria, for example none critical or high. The report should name each open defect, its impact, and any workaround, and record who accepted the risk.
No. A bug report describes one defect with the steps to reproduce it. A test report summarizes a whole test cycle, including how many defects were found and how severe they are. See our bug report template.
A blocked test couldn't be run, for example because the environment was down or a dependency was missing. It isn't a failure, but it is untested scope, so list blocked tests and the reason for each.
Mostly, yes. A test exit report records whether the exit criteria in the test plan were met. A test summary report includes that check and adds the results, defects, risks, and a recommendation.
Give passed tests as counts and percentages, and keep the detail for failures, blocked tests, and open defects. Link to the full run results for anyone who needs every passed case.



Test everything. Ship with confidence.
From generating test cases to spotting failures, Katalon's AI works across your entire pipeline, automatically.
