.svg)


Your testing team, from developers to testers, has put out a great amount of work to design test cases.
Knowing that an error-free testing process simply does not exist, when it comes to the test execution, this one fails, while the rest passes. Or, is one of them is taking much longer to complete compared to previous runs? How do you determine if your tests have slowed down or increased their probability of failing?
This requires context–historical logs from past sessions to be more specific. Without trends of test performance over time, decisions made and corrective measures could be misleading, resulting in wasted efforts, time, and the overall ROI for your project.
The Value of Software Testing Historical Data
Testing history provides the insights to make better decisions
It is, in fact, true numbers do not lie. Keeping a record of past test results will yield a more accurate judgment of test quality through visible trends of data accuracy & consistency. Subsequently, results collected throughout sessions would permit comparisons to older runs and provide a statistical basis for better product quality evaluation.
Testing history allows better monitoring of your projects’ health
How often does this test fail? How long did it take to run? Has this code been running as expected? With so many critical questions to determine the readiness of a release or product quality, not putting the proper efforts into organizing and keeping track of critical historical test data could leave teams puzzled and slows down the debugging process.
A good test history practice provides contexts for recurring failure and test flakiness
The notorious struggle of identifying root causes of why a test inconsistently passes and fails so often and who is responsible for it has always been present in testing teams. Proper historical data logging methods could help teams to compare vital metrics from multiple sessions, builds, and runs to quickly figure out the appropriate measures to be taken.
From the reasoning above, it could be generally accepted that a testing process without historical context is not a complete testing process. However, the different types of tests that would be needed to be executed throughout the Software Testing Life Cycle, say unit tests or smoke tests, would result in a large amount of data to be processed and stored.
When looking for an ideal solution for your project, it should be able to:
- Automatically collect and centralize results and key metrics after all sessions, thus eliminating manual efforts in inputting data with traditional methods like Excel.
- Empower collaboration through a completely accessible portal, allowing full-on involvement across all team members and contributors, regardless of expertise or technical backgrounds.
- Not require complicated setup and integration to allow a seamless onboarding process for the whole team.
- Comply with security guarantees to keep users’ data confidential and not to publish test results elsewhere.
- Give users total control of accessibility and sharing permissions to provide effective collaboration and visibility cross-team.
Katalon TestOps | Build Quality Insights into the CI/CD Pipeline.

Having fully recognized the need for effective historical data management and generating insightful reports for better quality assessment, Katalon TestOps has been introduced to help software testing teams to achieve Quality at Speed and maximize effective team collaboration.
Katalon TestOps is an advanced web-based test analytics hub with powerful test orchestration capabilities. Drawing data from common testing tools like Katalon Studio or open-source frameworks like Jasmine, Jest, Mocha, JUnit, and TestNG. Katalon TestOps enables teams to monitor and track testing progress at all stages with advanced real-time data visualizations and historical data storage for trends analysis. Not limited to just reporting, the tool also supports test planning, scheduling, management, and triggering remotely on machines like Kubernetes, and CircleCI.
The key features of Katalon TestOps include:
- An accessible and collaborative testing report platform for full visibility across teams
- Centralize all actions, project requirements for time-effective test management
- Effective data reflection based on historical data storage abilities to reduce test latency
- Providing statistical support to your release-readiness assessment
- Integrate with open-source testing frameworks (e.g. Pytest, JUnit, Jest, Mocha, Jasmine)
- Smart scheduling feature to plan and execute tests remotely on different environments (e.g. Kubernetes & Circle CI, Jenkins, Bamboo, Azure DevOps)
- Better context for debugging and flaky tests handling with detailed reports of their occurrences over time
To easier picture how Katalon TestOps would fit into your testing process, a chart is provided below for you.
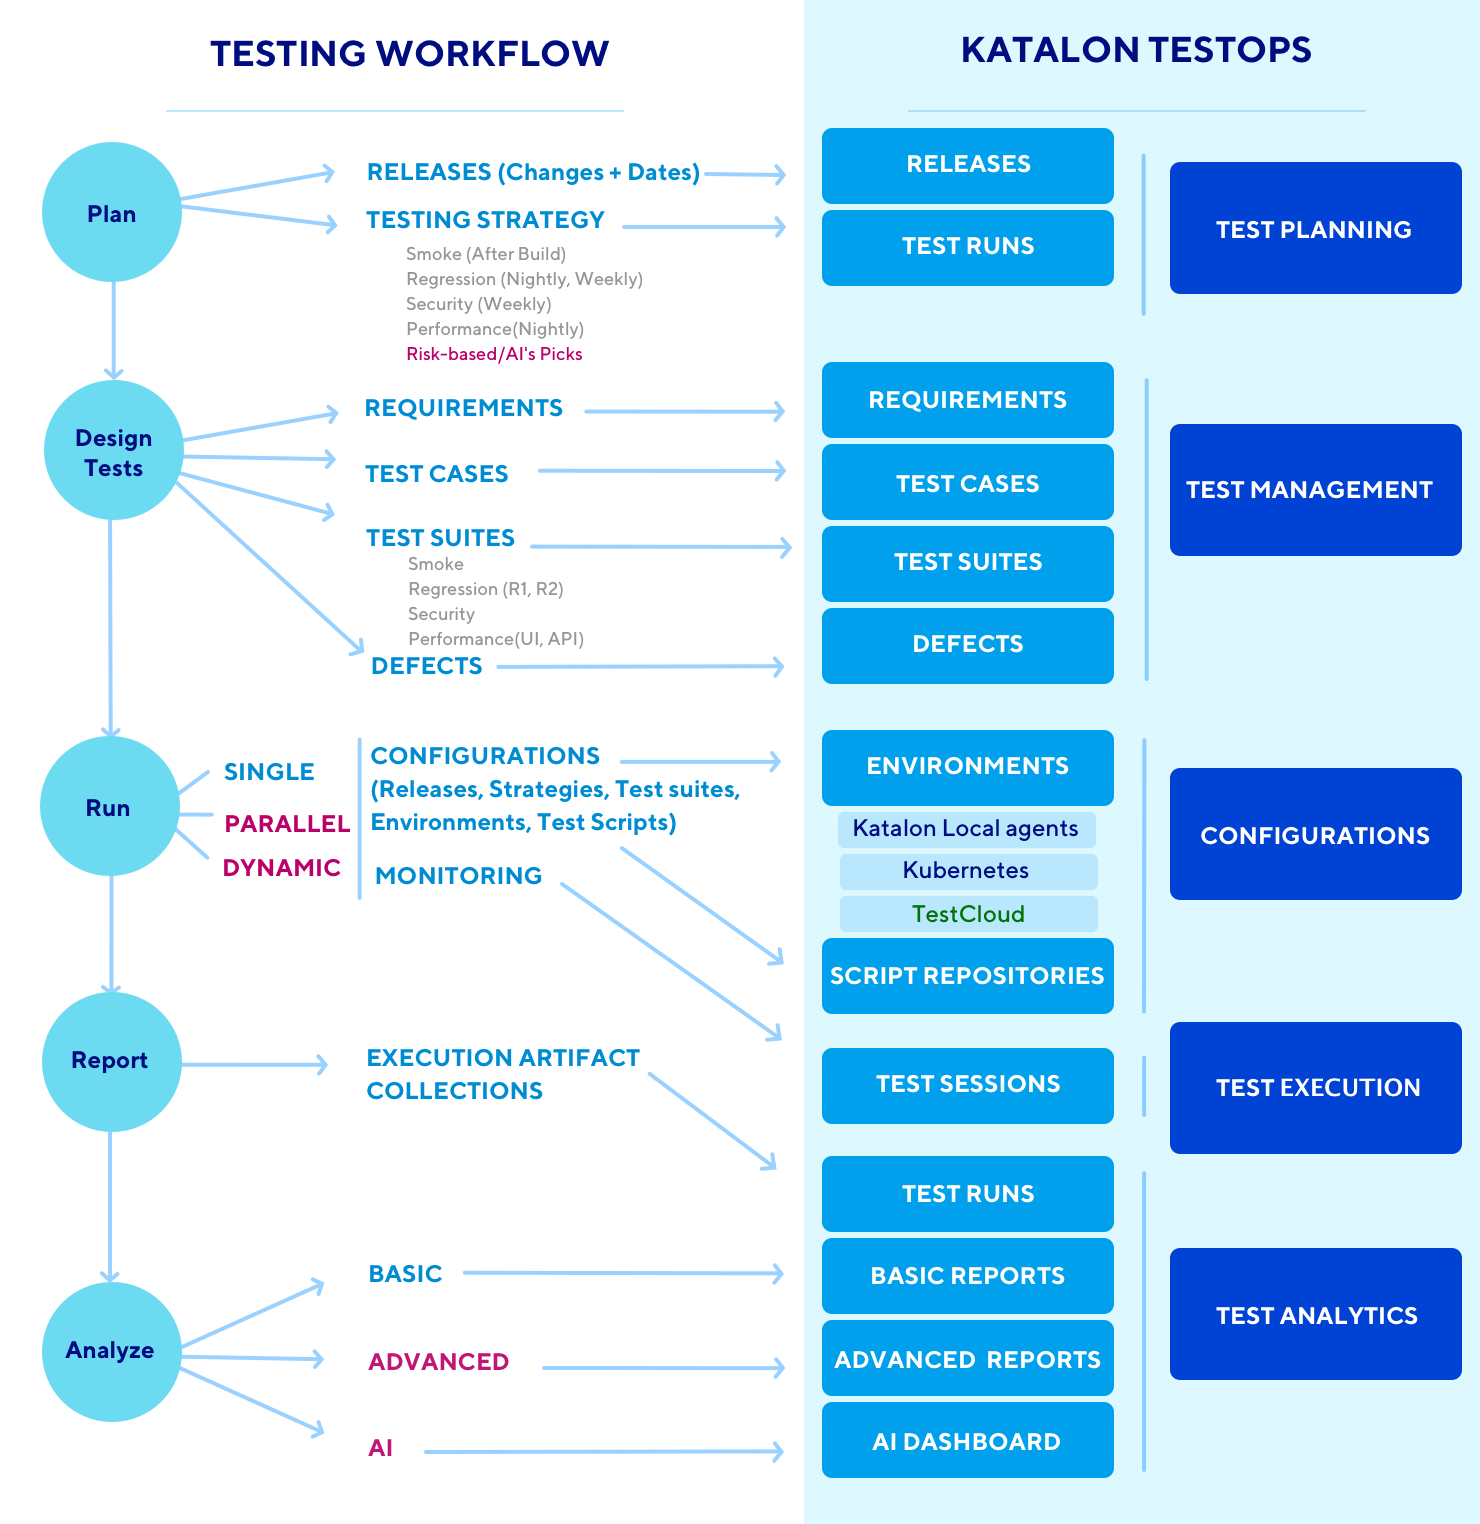
How Developers can Accelerate Testing Process with Katalon TestOps
Requiring no more than 3 minutes to set up, TestOps’ integration with JUnit, Jest, Mocha, Jasmine, Pytest frameworks allows data to be reported right after each test session into detailed documentation for you. Metrics ranging from test coverage or flakiness would all be included through diverse chart types to help your team visually inspect and analyze the outcomes.
As shown in the images below, the yielded test report is pretty straightforward to show visible trends through time, regardless of the framework used.
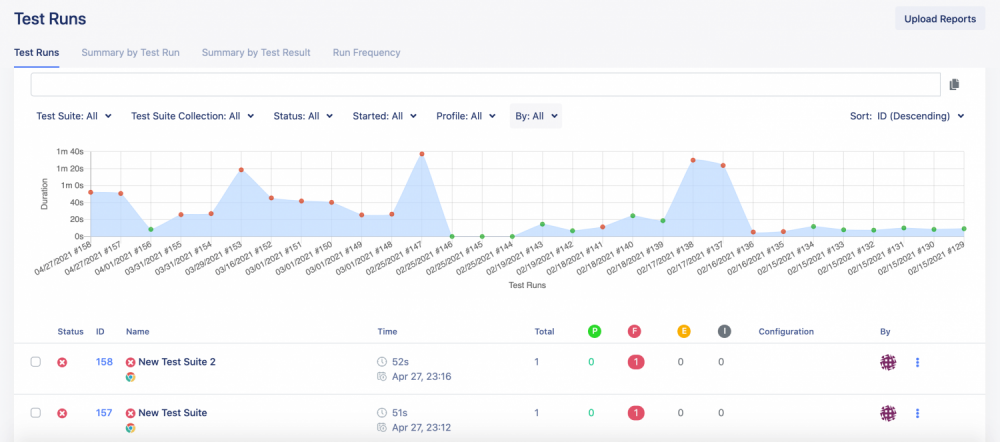
Test Run History
Displaying a test run history, you can see the time and date, the test status, the average duration of each test run, and by whom it was executed.
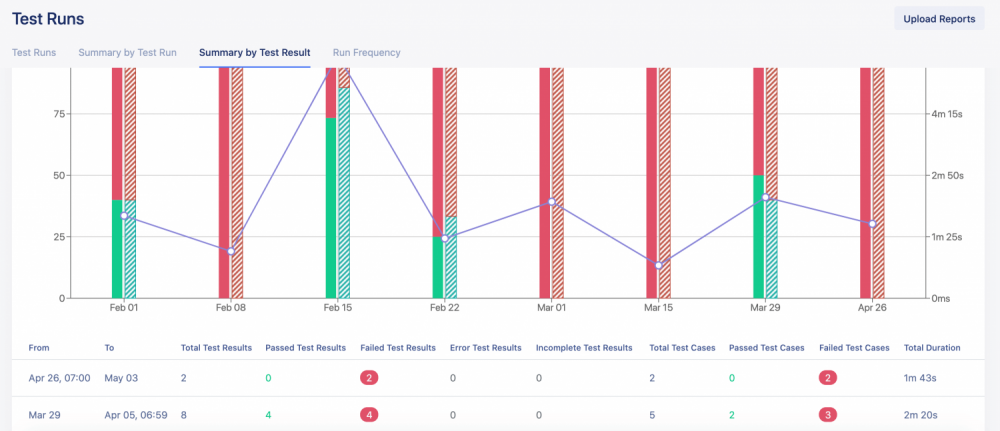
Status and Performance History
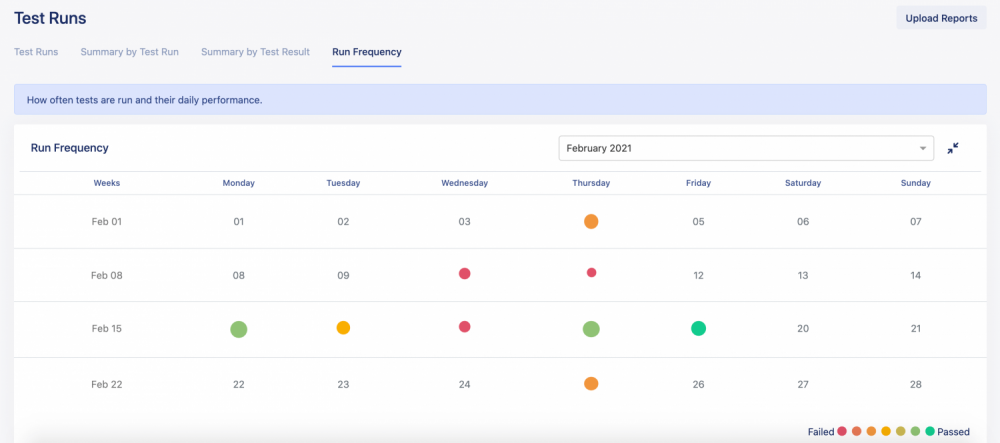
Run Frequency Report
You would also have the ability to choose different data representation options, such as vertical bar charts showing the status and performance of a session, or with a frequency report using colors to depict the frequency that a test passes or fails. Additionally, the sizes of the dot represent the number of test cases that have been run at a particular time.
What now?
The need to achieve quality at speed has become more prominent than ever.
While manually collecting and inputting data with traditional methods could still be considered an option, the resulting latency, false judgments, and wrong decisions could navigate your team down an endless search of an appropriate solution. It’s about time you and your team give this tool a go.
Get the right insights, make data-driven decisions as a team.

|